
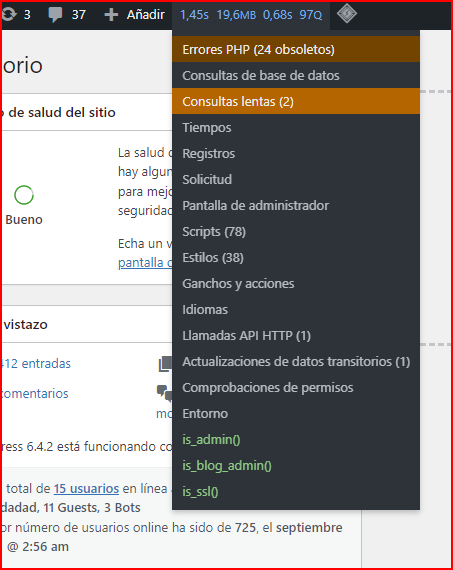
When you find yourself logged in as an administrator, you’ll notice a newly added item in the bar menu of the <a href="https://www.empresadeserviciosweb.com/que-opciones-de-busqueda-nos-permite-el-apartado-de-palabras-clave-en-google/" title="Guide on the Google keywords section: how to search, use tools and get <a href="https://www.empresadeserviciosweb.com/como-descargar-videos-de-tiktok-sin-letras/" title="Complete guide to download TikTok videos without watermark on Android — information, services and safe steps”>information safely”>administration tools: .
I recommend you check out this interesting article: We create Websites from scratch for your work on the Internet.
Administration Toolbar Menu
The numbers at the top display, sequentially:
Page generation time in seconds Maximum memory usage Total time of SQL queries in seconds Total number of SQL queries All the information presented by Query Monitor is for the load of the current page. Historical information is not available (althoughWhat is this functionality is planned for a future version).
Click on the top of the menu to open the Summary panel, or select any menu item to open its respective panel.
At first, your interest will likely focus on the Queries panel, which shows all the database queries made during the page load and allows you to filter and sort them, as well as determine which component was responsible for each query.
Troubleshooting a Slow Site So, your site is slow and you’ve chosen to install Query Monitor to identify the cause. There are some panels you should check first.
- Queries by Component The Queries → Queries by Component panel gives you aggregated information about the database queries executed by each plugin and theme during the page load. This is useful for identifying themes or plugins that have poor <a href="https://www.empresadeserviciosweb.com/codigos-windows-r-para-limpiar-el-sistema-lo-que-encontre-en-mi-busqueda/" title="How to use Windows R codes to clean the system, free up storage and improve disk performance“>performance.
This panel is organized according to the total time spent on all queries executed by each component. A plugin that makes a high number of queries or runs slow queries will contribute to the time your site takes to load.
Aggregated Database Queries by Component
- HTTP API Calls The HTTP API Calls panel gives you information about server-side requests made during the page load. These are often “invisible” causes of a slow site and can occur sporadically.
If a plugin or theme regularly triggers an HTTP API call during a page load, this will increase the time it takes your site to load.
HTTP API Requests
- Object Cache The Summary panel gives you information about various aspects of your site, one of which is the object cache. If you don’t have a persistent object cache plugin active, Query Monitor will display a message.
A persistent object cache plugin significantly improves performance by caching the result of operations such as database queries, HTTP API calls and other slow operations. By default, WordPress uses a non-persistent object cache, which means that repeated operations within the same page load are cached, but repeated operations between page loads are not.
If you see the message “External object cache not in use”, you should install an object cache plugin for a driver such as Redis or Memcached. This will allow the object cache to persist between page loads and significantly improve your site’s performance. Check with your hosting provider if you need help with this.
- PHP Errors The PHP Errors panel will only appear if some code executed during the page load causes a PHP error, such as a notice or a warning. If you see a red or orange highlight in the Query Monitor administration toolbar, it indicates that an error occurred and you should investigate it.
Code that triggers a Warning means that the code is not operating as expected and may be causing incorrect behavior on your site. You should investigate warnings immediately. Additionally, warnings can increase the time it takes your site to load because each error is logged on your server.
Code that triggers a Notice is less critical, but it should still be investigated, as it may be indicative of poorly written code. Notices may or may not be logged on your server depending on its configuration.
- Scripts and Styles If your site loads numerous javascript or CSS files, it won’t necessarily slow down the page generation time on your server, but it will lengthen the page load time for your visitors.
The Scripts and Styles panels show you which files have been enqueued through the WordPress dependency system. If these panels show a high number of files, you should consider installing a plugin that minifies and combines them.
Everything Else Despite its name, Query Monitor includes an extensive amount of functionality unrelated to database queries. For example, in the Requests panel you can view information about rewrite rules and query variables; in the Templates panel you can get information about the theme’s template hierarchy and template parts; and in the Environment panel you can review settings and information about your server.
Explore each of the panels and hopefully you’ll find something intriguing!